Running Gephi graph vizualization on OSX Mavericks (10.9.5)

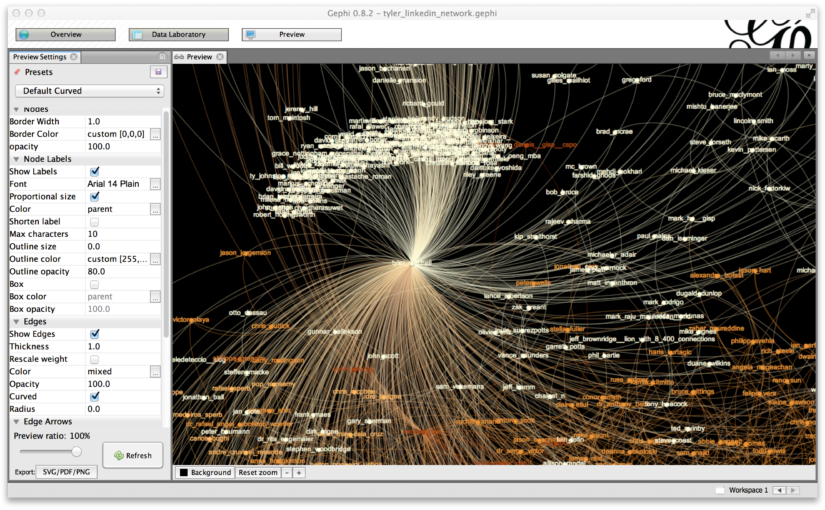
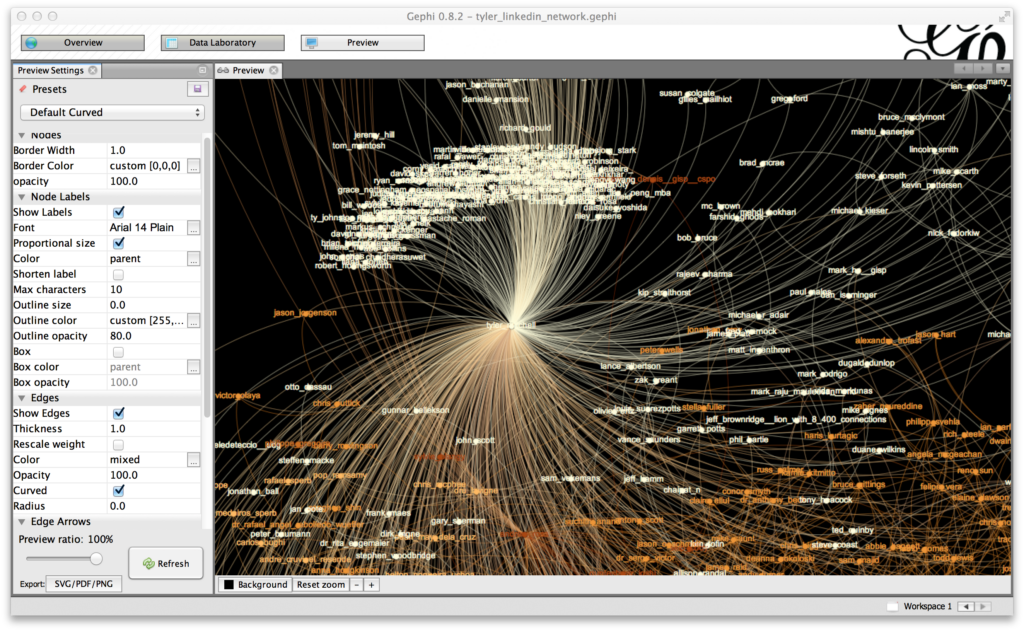
Gephi visualization running on OSX
Gephi running on OSX – showing Tyler’s social network from LinkedIn

Having trouble launching latest Gephi on OSX?  I’m running Mavericks but I’m sure this will help others who have upgraded or who are still running older versions of OSX.

From command line, use the jdkhome parameter when launching Gephi and point it to the system Java 1.6 install:

$ cd /Applications/Gephi.app/Contents/MacOS
$ ./Gephi --jdkhome /System/Library/Java/JavaVirtualMachines/1.6.0.jdk/Contents/Home/


Analytics Dashboard – Kibana 3 – a few short quick tips

After you’ve loaded log files into elasticsearch you can start to visualize them using the Kibana web app and build your own dashboard. While using Kibana for a week or so, I found it tricky to find the docs or tutorials to get me up to speed quickly with some of the more advanced/hidden features.

In this Kibana dashboard video:

  1. build TopN automated classification queries
  2. view the TopN values of a particular column from the table panel
  3. manually create multiple queries to appear as series in your charts

Supertunnels with SSH – multi-hop proxies

I never know what to call this process, so I’m inventing the term supertunnels via SSH for now. A lot of my work these days involves using clusters built on Amazon EC2 cloud environment. There, I have some servers that are externally accessible, i.e. web servers. Then there are support servers that are only accessible “internally” to those web servers and not accessible from the outward facing public side of the network, i.e. Hadoop clusters, databases, etc.

To help log into the “internal” machines, I have pretty much one choice – using SSH through the public machine first. No problem here, any server admin knows how to use SSH – I’ve been using it forever. However, I didn’t really use some of the more advanced features that are very helpful. Here are two…

Remote command chaining

Most of my SSH usage is for running long sessions on a remote machine. But you can also pass a command as an argument and the results come directly back to your current terminal:

$ ssh user@host "ls /usr/lib"

Take this example one step further and you can actually inject another SSH command that gets into the “internal” side of the network.

This is starting to really sound like tunneling, though it’s somewhat manual and doesn’t redirect traffic from your client side, we’ll get to that later.

As an aside, in EC2-land you often use certificate files during SSH login, so you don’t need to have an interactive password exchange. You specify the certificate with another argument. If that’s how you run your servers (or with authorized_keys files) then you can push in multiple levels of additional SSH commands easily.

For example, here I log into ext-host1, then from there log into int-host2 and run a command:

$ ssh -i ~/mycert.pem user@ext-host1 "ssh -i ~/mycert.pem user@int-host2 'ls /usr/lib'"

That is a bit of a long line for just getting a file listing, but it’s easy to understand and gets the job done quickly. It also works great in shell scripts, in fact you could wrap it up with a simple script to make it shorter.

Proxy config

Another way to make your command shorter and simpler is to add some proxy rules to the ~/.ssh/config file. I didn’t even know this file existed, so was thrilled to find out how it can be used.

To talk about this, let’s use the external and internal hosts as examples. And let’s assume that the internal host is 10.0.1.1. Obviously these don’t need to be specifically public or private SSH endpoints, but it serves its purpose for this discussion.

If we are typically accessing int-host2 via ext-host1 then we can setup a Proxy rule in the config file:

Host 10.0.*.*
ProxyCommand ssh -i ~/mycert.pem user@ext-host1 -W %h:%p

This rule watches for any requests on the 10.0… network and automatically pushes the requests through the ext-host1 as specified above. Furthermore, the -W option tells it to stream all output back to the same terminal you are using. (Minor point, but if you miss it you may go crazy trying to find out where your responses go.)

Now I can do a simple login request on the internal host and not even have to think about how to get there.

ssh -i ~/mycert.pem user@int-host2

I think that’s a really beautiful thing – hope it helps!

Another time I’ll have to write more about port forwarding…
Converting Decimal Degree Coordinates

Converting Decimal Degree Coordinates to/from DMS Degrees Minutes Seconds

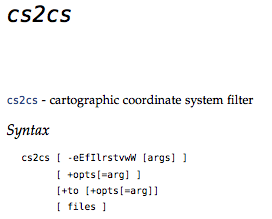
cs2cs command from GDAL/OGR toolset (gdal.org) - allows robust coordinate transformations.
cs2cs command from GDAL/OGR toolset (gdal.org) – allows robust coordinate transformations.

If you have files or apps that have to filter or convert coordinates – then the cs2cs command is for you.  It comes with most distributions of the GDAL/OGR (gdal.org) toolset.  Here is one popular example for converting between degrees minutes and seconds (DMS) and decimal degrees (DD).


Geospatial Power Tools book coverThe following is an excerpt from the book: Geospatial Power Tools – Open Source GDAL/OGR Command Line Tools by me, Tyler Mitchell.  The book is a comprehensive manual as well as a guide to typical data processing workflows, such as the following short sample…


Input coordinates can come from the command line or an external file. Assuming a file containing DMS (degree, minute, seconds) style, looks like:

124d10'20"W 52d14'22"N
122d20'05"W 54d12'00"N

Use the cs2cs command, specifying how the print format will be returned, using the -f option. In this case -f “%.6f”
is explicitly requesting a decimal degree number with 6 decimals:

cs2cs -f "%.6f" +proj=latlong +datum=WGS84 input.txt

Example Converting DMS to/from DD

This will return the results, notice no 3D/Z value was provided, so none is returned:

-124.172222 52.239444 0.000000
-122.334722 54.200000 0.000000

To do the inverse, remove the formatting option and provide a list of values in decimal degree (DD):

cs2cs +proj=latlong +datum=WGS84 inputdms.txt
124d10'19.999"W 52d14'21.998"N 0.000
122d20'4.999"W 54d12'N 0.000


Geospatial Power Tools is 350+ pages long – 100 of those pages cover these kinds of workflow topic examples. Each copy includes a complete (edited!) set of the GDAL/OGR command line documentation as well as the following topics/examples:

Workflow Table of Contents

  1. Report Raster Information – gdalinfo
  2. Web Services – Retrieving Rasters (WMS)
  3. Report Vector Information – ogrinfo
  4. Web Services – Retrieving Vectors (WFS)
  5. Translate Rasters – gdal_translate
  6. Translate Vectors – ogr2ogr
  7. Transform Rasters – gdalwarp
  8. Create Raster Overviews – gdaladdo
  9. Create Tile Map Structure – gdal2tiles
  10. MapServer Raster Tileindex – gdaltindex
  11. MapServer Vector Tileindex – ogrtindex
  12. Virtual Raster Format – gdalbuildvrt
  13. Virtual Vector Format – ogr2vrt
  14. Raster Mosaics – gdal_merge

My new book on Amazon – raster/vector data manipulation using GDAL/OGR

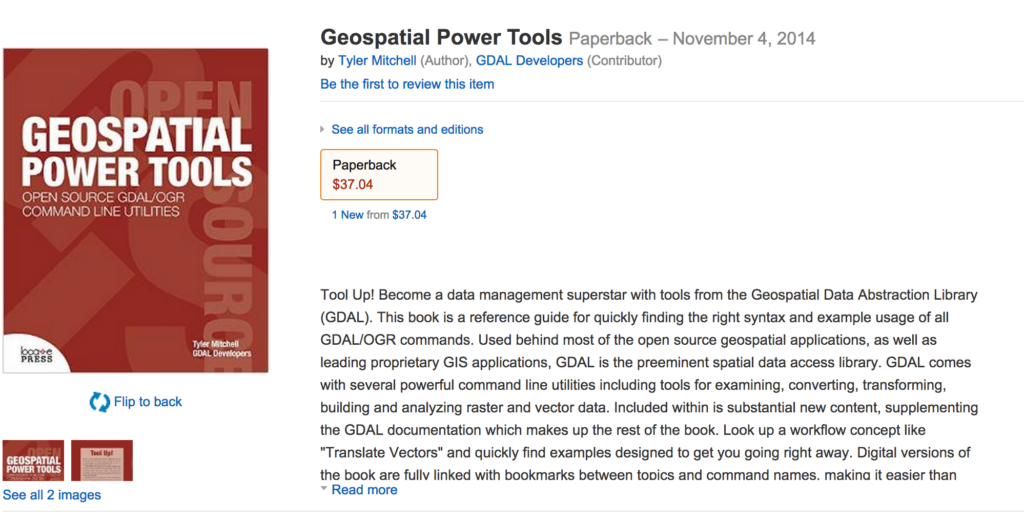
Geospatial Power Tools by Tyler Mitchell now on Amazon

Ten years ago I wrote a book for O’Reilly called Web Mapping Illustrated – using open source GIS tools. It was mostly about how to use MapServer and PostGIS to publish maps on the web and was the first of its kind in the marketplace.

This year I’ve completed my second book, for Locate Press, which focused on even more low level geospatial data manipulation using the GDAL/OGR command line tools. This was a work-in-progress for a couple of years, but has just now been released on Amazon as Geospatial Power Tools.

If you’re looking for a resource to understand how to convert imagery, vector data or to build elevation shaded maps or contours, and more, then this book is for you. It includes complete GDAL and OGR documentation. A third of the book presents new material geared to help you learn how to do specific kinds of processing tasks – from downloading from web services, to quickly converting imagery into an online map. A PDF version is also available and Kindle will likely come over the next 6 months.

I’m always interested in feedback on the book and to learn more about how to improve the next edition.

Create Tile Map Structure – gdal2tiles command

Tiles in a Tile Map Server (TMS) context are basically raster map data that’s broken into tiny pre-rendered tiles for maximum web client loading efficiency. GDAL, with Python, can chop up your input raster into the folder/file name and numbering structures that TMS compliant clients expect.

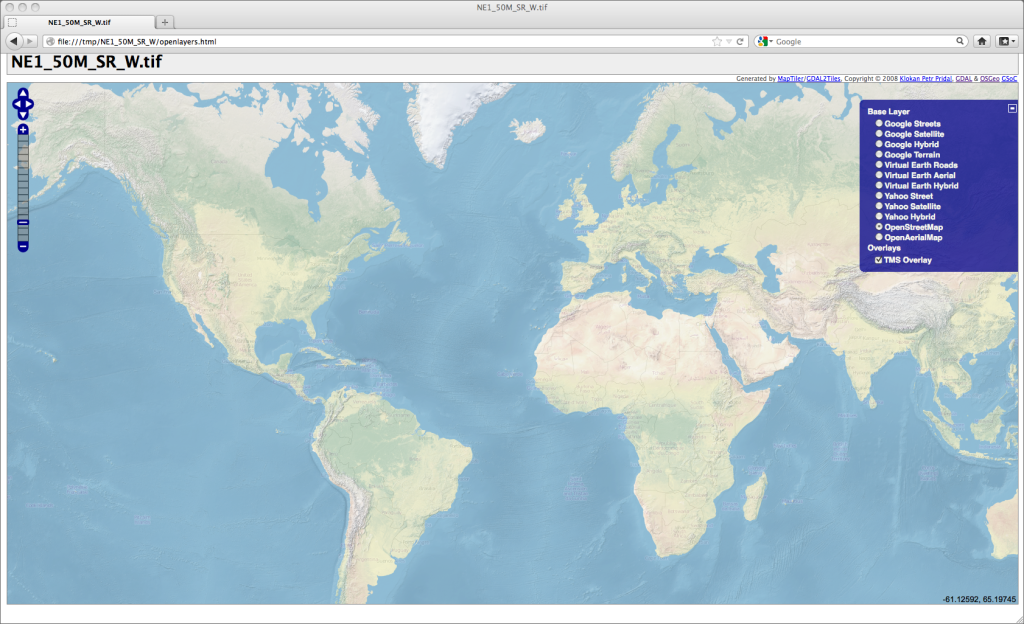
OpenLayers mapping application showing natural earth dataset
Default OpenLayers application produced by the gdal2tiles command and a Natural Earth background dataset as input.

This is an excerpt from the book: Geospatial Power Tools – Open Source GDAL/OGR Command Line Tools by me, Tyler Mitchell.  The book is a comprehensive manual as well as a guide to typical data processing workflows, such as the following short sample…

The bonus with this utility is that it also creates a basic web mapping application that you can start using right away.

The script is designed to use georeferenced rasters, however, any raster should also work with the right options. The (georeferenced) Natural Earth raster dataset is used in the first examples, with a non-georeferenced raster at the end.

There are many options to tweak the output and setup of the map services; see the complete gdal2tiles chapter for more information.

Minimal TMS Generation

At the bare minimum an input file is needed:

gdal2tiles.py NE1_50M_SR_W.tif
Generating Base Tiles:
0...10...20...30...40...50...60...70...80...90...100 - done.
Generating Overview Tiles:
0...10...20...30...40...50...60...70...80...90...100 - done.

The output created is the same name as the input file, and include an array of sub-folders and sample web pages:

NE1_50M_SR_W
NE1_50M_SR_W/0
NE1_50M_SR_W/0/0
NE1_50M_SR_W/0/0/0.png
NE1_50M_SR_W/1
...
NE1_50M_SR_W/4/9/7.png
NE1_50M_SR_W/4/9/8.png
NE1_50M_SR_W/4/9/9.png
NE1_50M_SR_W/googlemaps.html
NE1_50M_SR_W/openlayers.html
NE1_50M_SR_W/tilemapresource.xml

Open the openlayers.html file in a web browser to see the results.

The default map loads a Google Maps layer, it will complain that you do not have an appropriate API key setup in the file, ignore it and switch to the OpenStreetMap layer in the right hand layer listing.


The resulting map should show your nicely coloured world map image from the Natural Earth dataset. The TMS Overlay option will show in the layer listing, so you can toggle it on/off to see that it truly is loading. Figure 5.2 (above) shows the result of our gdal2tiles command.


Geospatial Power Tools is 350+ pages long – 100 of those pages cover these kinds of workflow topic examples.  Each copy includes a complete (edited!) set of the GDAL/OGR command line documentation as well as the following topics/examples:

Workflow Table of Contents

  1. Report Raster Information – gdalinfo 23
  2. Web Services – Retrieving Rasters (WMS) 29
  3. Report Vector Information – ogrinfo 35
  4. Web Services – Retrieving Vectors (WFS) 45
  5. Translate Rasters – gdal_translate 49
  6. Translate Vectors – ogr2ogr 63
  7. Transform Rasters – gdalwarp 71
  8. Create Raster Overviews – gdaladdo 75
  9. Create Tile Map Structure – gdal2tiles 79
  10. MapServer Raster Tileindex – gdaltindex 85
  11. MapServer Vector Tileindex – ogrtindex 89
  12. Virtual Raster Format – gdalbuildvrt 93
  13. Virtual Vector Format – ogr2vrt 97
  14. Raster Mosaics – gdal_merge 107

Create a Union VRT from a folder of Vector files

The following is an excerpt from the book: Geospatial Power Tools – Open Source GDAL/OGR Command Line Tools by me, Tyler Mitchell.  The book is a comprehensive manual as well as a guide to typical data processing workflows, such as the following short sample…

The real power of VRT files comes into play when you want create virtual representations of features as well.  In this case, you can virtually tile together many individual layers as one.  At the present time you cannot do this with a single command line but it only takes adding two simple lines to the VRT XML file to make it start working.

Here we want to create a virtual vector layer from all the files containing lines in the ne/10m_cultural folder.

First, to keep it simple, create a folder and copy in only the files we are interested in:

mkdir ne/all_lines 
cp ne/10m_cultural/*lines* ne/all_lines

Then we can create our VRT file using ogr2vrt as shown in the previous example:

python ogr2vrt.py -relative ne/all_lines all_lines.vrt

If added to QGIS at this point, it will merely present a list of four layers to select to load. This is not what we want.

So next we edit the resulting all_lines.vrt file and add a line that tells GDAL/OGR that the contents are to be presented as a unioned layer with a given name (i.e. “UnionedLines”).

The added line is the second one below, along with the closing line second from the end:

<OGRVRTDataSource>
 <OGRVRTUnionLayer name="UnionedLines">
  <OGRVRTLayer name="ne_10m_admin_0_boundary_lines_disputed_areas">
   <SrcDataSource relativeToVRT="1" shared="1">
   ...
   <Field name="note" type="String" src="note" width="200"/>
  </OGRVRTLayer>
 </OGRVRTUnionLayer>
</OGRVRTDataSource>

Now loading it into QGIS automatically loads it as a single layer but, behind the scenes, it is a virtual representation of all four source layers.

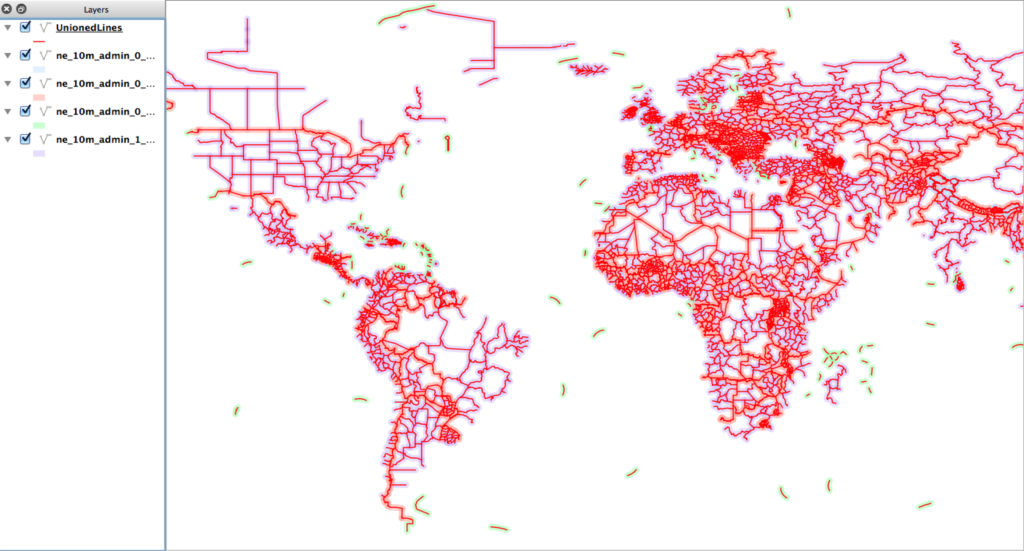
On the map in Figure 5.8 the unionedLines layer is drawn on top using red lines, whereas all the source files (that I manually loaded) are shown with a light shading. This shows that the new virtual layer covers all the source layer features.

Unioned OGR VRT layers - source layers beneath final resulting merged layer
Unioned OGR VRT layers – source layers beneath final resulting merged layer


Geospatial Power Tools is 350 pages long – 100 of those pages cover these kinds of workflow topic examples.  Each copy includes a complete (edited!) set of the GDAL/OGR command line documentation as well as the following topics/examples:

Workflow Table of Contents

  1. Report Raster Information – gdalinfo 23
  2. Web Services – Retrieving Rasters (WMS) 29
  3. Report Vector Information – ogrinfo 35
  4. Web Services – Retrieving Vectors (WFS) 45
  5. Translate Rasters – gdal_translate 49
  6. Translate Vectors – ogr2ogr 63
  7. Transform Rasters – gdalwarp 71
  8. Create Raster Overviews – gdaladdo 75
  9. Create Tile Map Structure – gdal2tiles 79
  10. MapServer Raster Tileindex – gdaltindex 85
  11. MapServer Vector Tileindex – ogrtindex 89
  12. Virtual Raster Format – gdalbuildvrt 93
  13. Virtual Vector Format – ogr2vrt 97
  14. Raster Mosaics – gdal_merge 107

Spatialguru change on Twitter/Google Plus accounts

As a result of moving slightly away from “spatial” as a core focal area in my day-to-day work at Actian.com – (I do way more with Hadoop than spatial these days),  I started a new Twitter account with a less domain specific name.

My original Twitter account was spatialguru – I still use it, but less often than before . Now I’m using 1tylermitchell instead.

When I started calling myself spatialguru it was a bit of an inside joke around our home, I didn’t think it would still around this long.  🙂 Anyway, follow my new account if you want to see more about what I’m reading, etc.

Similarly, I have tried to migrate my previous Google plus account – tmitchell.osgeo – to a new one here.  Add me to your circles and I’ll probably add you to mine if you aren’t already.

Now, what to do about this blog name.. hmm.. more to come.

— Tyler

Query Vector Data Using a WHERE Clause – ogrinfo

The following is an excerpt from the book: Geospatial Power Tools – Open Source GDAL/OGR Command Line Tools by Tyler Mitchell.  The book is a comprehensive manual as well as a guide to typical data processing workflows, such as the following short sample…

Use SQL Query Syntax with ogrinfo

Use a SQL-style -where clause option to return only the features that meet the expression. In this case, only return the populated places features that meet the criteria of having NAME = ’Shanghai’:

$ ogrinfo 10m_cultural ne_10m_populated_places -where "NAME = 'Shanghai'"

... 
Feature Count: 1 Extent: (-179.589979, -89.982894) - (179.383304, 82.483323) 
... 
OGRFeature(ne_10m_populated_places):6282
 SCALERANK (Integer) = 1 
 NATSCALE (Integer) = 300 
 LABELRANK (Integer) = 1 
 FEATURECLA (String) = Admin-1 capital 
 NAME (String) = Shanghai
... 
 CITYALT (String) = (null) 
 popDiff (Integer) = 1 
 popPerc (Real) = 1.00000000000 
 ls_gross (Integer) = 0 
 POINT (121.434558819820154 31.218398311228327)

Building on the above, you can also query across all available layers, using the -al option and removing the specific layer name. Keep the same -where syntax and it will try to use it on each layer. In cases where a layer does not have the specific attribute, it will tell you, but will continue to process the other layers:

   ERROR 1: 'NAME' not recognised as an available field.

NOTE: More recent versions of ogrinfo appear to not support this and will likely give FAILURE messages instead.


Geospatial Power Tools is 350 pages long – 100 of those pages cover these kinds of workflow topic examples.  Each copy includes a complete (edited!) set of the GDAL/OGR command line documentation as well as the following topics/examples:

Workflow Table of Contents

  1. Report Raster Information – gdalinfo 23
  2. Web Services – Retrieving Rasters (WMS) 29
  3. Report Vector Information – ogrinfo 35
  4. Web Services – Retrieving Vectors (WFS) 45
  5. Translate Rasters – gdal_translate 49
  6. Translate Vectors – ogr2ogr 63
  7. Transform Rasters – gdalwarp 71
  8. Create Raster Overviews – gdaladdo 75
  9. Create Tile Map Structure – gdal2tiles 79
  10. MapServer Raster Tileindex – gdaltindex 85
  11. MapServer Vector Tileindex – ogrtindex 89
  12. Virtual Raster Format – gdalbuildvrt 93
  13. Virtual Vector Format – ogr2vrt 97
  14. Raster Mosaics – gdal_merge 107
WordPress Appliance - Powered by TurnKey Linux