Would love to hear how you partition your spatial data..
As data volumes grow, so does your need to understand how to partition your data. Until you understand this distributed storage concept, you will be unable to choose the best approach for the job. This post gives an introductory explanation of partitioning and you will see why it is integral to the Hadoop Distributed File System (HDFS) increasingly used in modern big data architectures….
Recently I started an Internet of Things series on my experiences installing, using and analysing data from a smart electrical meter. This included a BC Hydro smart meter, Eagle monitoring gateway from rainforest automation, and a cloud-based analytics service from Bidgely.
I’ve collated all the posts on the topic for you below. More will be added as I write them. Enjoy!
IoT Day 1: Home Energy Monitoring(3/27/2015)- In my next series of blog posts we explore an Internet of Things topic – Home energy monitoring – from a first person perspective. Join me as I install, use and hack a monitor (and related cloud services) in my new home. This is part 1 of a series of posts about the Internet of … Continue reading IoT Day 1: Home Energy Monitoring
IoT Day 2: Cloud Services for Energy Monitoring(3/28/2015)-Energy monitoring isn’t only about knowing what’s happening right now, but also understanding what happened historically. Often that includes knowing not just what was happening but also when and why. Enter cloud services for energy monitoring. They range from simple charts and graphs to predicting your usage over time – essentially storing, analysing and enriching your … Continue reading IoT Day 2: Cloud Services for Energy Monitoring
Energy monitoring isn’t only about knowing what’s happening right now, but also understanding what happened historically. Often that includes knowing not just what was happening but also when and why. Enter cloud services for energy monitoring. They range from simple charts and graphs to predicting your usage over time – essentially storing, analysing and enriching your raw data.
In this post I review two cloud services that I’ve tried so far and show you what you get from them.
This is part 2 of a series of posts about the Internet of Things applied to Home Energy Monitoring.
The rainforest automation Eagle unit I have comes pre-configured with support for a few different cloud services: Wattvision, BuildingOS, Bidgely, BlueDot. (Ignore the Powereye entry for now, that’s just me mucking around).
Eagle monitor cloud service configuration options
To enable a service:
Create an account on the website for one of the services (links above)
Provide them with your Cloud ID as shown in the config screens on the Eagle
Select the cloud provider in the Eagle settings and choose Set Cloud
Wait – Give it a minute to get started. It will restart some stuff on the Eagle device
Visit the service provider website to see what’s going on
BlueDot service config screen
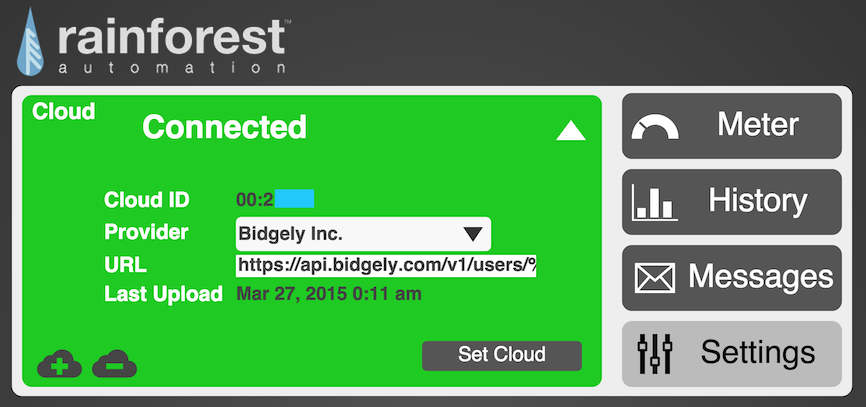
Bidgely energy monitoring config settings
Behind the Scenes
What exactly happens when you choose a cloud provider in the Eagle settings?
When one is chosen, the Eagle device will transmit the energy data to the provider. Along with your device identifier, with every reading it generates a data packet for the provider to read and use in its system. The system detects that it’s your data and makes it available to your account.
The bonus is that this results in you essentially having a copy of the data available elsewhere, on another server. What that server does with it after is its own business. Each provider has their own website tools and/or mobile apps that access your data and the results of their services.
So don’t expect anything on the Eagle screens to change when these are configured, it’s only sending a copy of the data and you have to go to those other sites/apps to get the added value.
As an aside, you could even set up your own server and stream your data to it! More on that in the future.
BlueDot
BlueDot was the first service I tried. It provides a very basic set of features, pretty much all being shown in this chart summary screen.
BlueDot Energy Monitor Dashboard
The charts seem to show the data in 15 minute increments.
I haven’t run it long enough to really get full value from the service. At the bottom of the screen there is a My Recommendations section. As it analyses more data it will add value in this spot. They explain on their website:
Our cloud-based servers constantly analyze your home energy usage and use this information to create personalized money-saving recommendations and special offers. These recommendations are sent to the “Just For You” page in your BlueDot web browser or smartphone application.
Sounds good to me! I hope to give it a more thorough test in the future.
If all you want is a simple chart right out of the box, this was very easy to get started with.
Bidgely
Most of the past day I’ve been running with the Bidgely service, so I’ve now got 24 hours worth of data to show.
Bidgely Energy Monitor Dashboard
The dashboard is rich with information. There are also two chart views, one showing usage (“demand”) and one showing an energy billing estimate.
During the configuration stage you tell it what utility you are getting your energy from and it will config the rate.
The most interesting part of Bidgely is the application of data analytics. To start with, they have a tool that helps you train their system and to give you an estimate of how much it costs you to use an appliance. You can use the mobile app or the website to tell it, for example, that you are going to turn on your air conditioner. The service will watch for a few seconds or a minute and identify what kind of spike that device creates.
Bidgely Appliance Detective Mode
It is actually fun to go through their list and activate all the appliances you own!
The list is not comprehensive yet but I expect it will become longer in the future. Based on comments in their community forums, users also want to be able to track other appliances or even their custom ones.
Bidgely’s main focus is not just on showing the data, but on identifying which appliances use what amounts of energy. You can see this in the dashboard screen in the centre-left. I called my system Whole House. They automagically created a sub-group called Always On – that’s the baseline usage that never seems to go away. I’ll be attacking those energy vampires in the future too!
As they collect more data, my appliances will start to show up here as well. That will be really cool. I’m not sure how long it will take, but sounds like it might take a month or two before that happens.
At the end of the day I’ll be able to see which appliances use the most power and then adjust accordingly.
Summary
So far I haven’t made any huge discoveries or conclusive decisions for how to save on energy. However, I did realise that the water heater is a secret sucker – it is so far out of sight and mind that I didn’t even think about it until I saw a strange plateau spike up at 11pm – when I had already shut down all my appliances and after I had showered before bed.
My space heaters are the largest culprits so far and next is the oven. I figured this out just by looking at the times and watching what was going on around me.
At this pace I’ll soon be able to have my own, personal, conclusive evidence of which is better for heating tea – microwave or stove top. Then everything will be right in the world!
Stay tuned for a review of more cloud services in my next post of this series. Find me on Twitter to share more ideas or leave a comment to tell me what other areas you would like to learn about on this topic.
In my next series of blog posts we explore an Internet of Things topic – Home energy monitoring – from a first person perspective. Join me as I install, use and hack a monitor (and related cloud services) in my new home.
This is part 1 of a series of posts about the Internet of Things applied to Home Energy Monitoring.
I recently moved into a new home that uses electric heat exclusively. Having come from a natural gas forced air furnace, I wasn’t sure what to expect in terms of cost. I used to just keep the thermostat at 20C and forget about it. After hearing some horror stories about $800 electricity bills for heating this place, monitoring it became a little more important to me. So, I ordered an energy monitor.
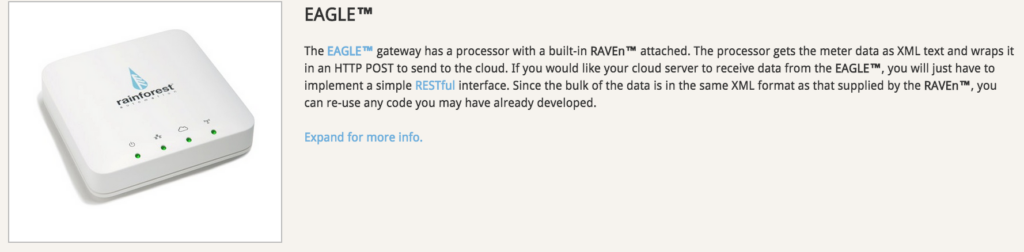
Eagle energy monitor IoT device from Rainforest Automation
In my next post I’ll talk about how I connect it to some cloud services and see what they provide. In the end, it is ultimately an open platform and boasts a REST API and developer documents that I’ll be digging into.
Smart Meter 101
They communicate wirelessly using a Zigbee compatible protocol. So the Eagle monitoring unit is capturing data from that broadcast (the current meter reading counter) and storing it on the device with a timestamp. This leads to some other questions as well, especially for the DIY device hacker.
Are there other ways of capturing that data without Zigbee – i.e. optical? I think there are but haven’t investigated it much as this option was pre-configured and not horrendously expensive (~$60) for getting an embedded system with web server, Zigbee and more (can’t wait to hack this sucker!).
Does the meter actually store any historical data? I’m hoping to find out, but I believe that all it spits out is the current meter counter, so it doesn’t matter if it misses a bunch of transmissions, it will correct itself later on.
Can I read my neighbours? Looks like you need some special ID numbers generated from a hydro service account to access the meter, so I doubt that I’ll be trying it on others.
In-Device Application
After plugging it in and hooking it to an ethernet cable to my router, all the green lights came on except the Cloud light (as I hadn’t configured it yet). The unit had a label on the underside with the name of the device as it would appear on my network eagle-xxxxxx.local – I just checked my router and used the IP directly.
First they tell you to go to their website and enter in a few codes from the label. I didn’t get too far with that until I actually powered off the device once and restarted it. Then I could hit the host/IP and start using it right away. I did send a support request to them mentioning some of these issues and they actually updated their docs, so be sure to communicate early if you are working through a similar scenario it yourself.
The Eagle unit runs a few services, e.g. the RESTful interface and a web server that you can hit directly when plugged into your local network. The main part of the UI I’m interested in is a usage History graph, showing hourly, daily or weekly usage. It also has a download feature so you can get a CSV text file showing the same data.
I’m not sure yet how much data it will retain, guess we’ll find out tomorrow.
Graph showing electricity usage from an Eagle home enery monitor
Feeding External Services
Eagle energy monitor UI for configuring cloud connected services
An important part of the Settings in the unit are for configuring cloud services. When configured, the Eagle unit can push data to an external service. There are a few pre-defined ones, BlueDot, Bidgely, etc. but also the option to add your own custom service URL. (Which tells that I think I know what Part III of this post will be already 🙂 )
The only bummer I noticed with the cloud services so far is that, at least with the one I’ve tested, it only works when a web connection is online. Although the monitor will continue to store data and you can view it in the devices history chart, it does not re-send records to an external service after a network failure.
So, if you are like me and want to even shut down your Internet at night to save energy, just don’t expect to gain all the benefits. More on that later. Until then, I’ll be leaving it all on so we can see how things go.
Next Steps
My next planned steps are to get a baseline for my energy usage during the day. It’s actually pretty easy for me to see how it’s going throughout the day as I work from home and several of us are in the house all day long. It’s pretty cool so far to see a spike go up when heaters turn on or the hot water is getting low.
First World Problems
Although I’m going to try to get my energy bill down, I’m still amazed at how cheap our power is, especially relative to those in the world who don’t have access to any. So if I look like I’m out of touch trying to save a few cents a day keep in mind, I’d pay 10x my current bill before I gave up my clean, hydro-generated, renewable power in place of a dark hut with a dung fire! I’m very thankful I can even run these experiments.