Recently I started an Internet of Things series on my experiences installing, using and analysing data from a smart electrical meter. This included a BC Hydro smart meter, Eagle monitoring gateway from rainforest automation, and a cloud-based analytics service from Bidgely.
I’ve collated all the posts on the topic for you below. More will be added as I write them. Enjoy!
IoT Day 1: Home Energy Monitoring(3/27/2015)- In my next series of blog posts we explore an Internet of Things topic – Home energy monitoring – from a first person perspective. Join me as I install, use and hack a monitor (and related cloud services) in my new home. This is part 1 of a series of posts about the Internet of … Continue reading IoT Day 1: Home Energy Monitoring
IoT Day 2: Cloud Services for Energy Monitoring(3/28/2015)-Energy monitoring isn’t only about knowing what’s happening right now, but also understanding what happened historically. Often that includes knowing not just what was happening but also when and why. Enter cloud services for energy monitoring. They range from simple charts and graphs to predicting your usage over time – essentially storing, analysing and enriching your … Continue reading IoT Day 2: Cloud Services for Energy Monitoring
After a week of collecting smart meter readings, I’m now ready to show results in a cloud-based energy monitor system – Bidgely – complete with graphs showing readings, cost and machine learning results breaking down my usage by appliance.
This is part 4 of a series of posts about the Internet of Things applied to Home Energy Monitoring. I have a Smart Meter from BC Hydro, an Eagle energy monitor and various cloud apps helping me understand it all.
In this post I’ll show you the three parts of Bidgely that I’ve found most helpful:
Usage dashboard
Cost dashboard
Appliance breakdown (best for last!)
Usage Dashboard
Bidgely Energy Monitor – Usage Dashboard
The main part of the dashboard includes the energy usage during a given period of time – in detail and an overall amount. The usage dashboard is chosen by selecting the lightning bolt symbol in the top right. On the top left you change the time period for the dashboard. Changing it to Billing Cycle or Year will summarise the data into larger groups of time – days or months.
In the 24 Hour time period, the chart shows the amount of kilowatts used in 5 minute time periods. You can mouse-over a point and get the detailed information. This view helps you to understand what your energy usage is like and can help you identify any usage you didn’t know about.
For example, the small spikes throughout the middle of the night were confusing at first, but I figured out that it was the refrigerator running every hour or so. This leads me to know that to reduce that usage I could get a more efficient fridge or take other actions such as placing some jugs of water in the fridge to help retain the cold better. We’ll try that another time and see what effect it has.
Cost Dashboard
Bidgely Energy Monitor – Cost Dashboard
Very similar to the usage dashboard, the 24 Hour view shows the cost of the usage summarised by hour, just as the hydro company will do their billing. This screen is turned on by the $ symbol button in the top right. Mouse over the chart shows more details, include any different Tier usage your utility may have in place.
Appliance Breakdown
Now here is where the real secret sauce of Bidgely gets applied. Showing charts of usage and cost isn’t rocket science, but applying machine learning to gaining further insight into your usage/costs is really useful. Let’s look at an example in this screenshot. Notice the bottom left shows a breakdown of usage by appliance. When you select one, it shows it in the chart and gives a summary % in the bar below the chart:
Bidgely Energy Monitor – Appliance Breakdown
This breakdown magically appears when their algorithms and machine learning analysis start to see patterns of usage in your data. Just like I could instinctively see my refrigerator usage, data analysis can detect similar patterns and make certain assumptions. For example, my heating system draws 1.5kW, so when there is a 1.5kW increase in usage, the assumption can be that my heater turned on. That’s a fairly simple example that isn’t going to gain any venture capital funding.
Things get way more interesting when engineers can determine what appliances are running simultaneously. When a second appliance begins running, say my fridge, at another 0.8kW how can it figure this out? This takes a combination of factors – additional guestimates about typical fridge usage, as well as frequency and duration – together these produce a super smart system that can determine these factors.
The only downside I see so far is that this analysis happens after-the-fact. The initial analysis took about 3-4 days, then they emailed me to tell me they had discovered my “always on” usage, heating system, fridge and clothes dryer. I’m super curious if it will also find my water heater and another space heater I have. Time will tell.
Wish List
Real-time Analytics
I’m also curious if it can become faster at identifying these components. Not an easy feat but I’m sure it’s on their TODO list already. [Perhaps they need a higher performance analytic platform like we produce at Actian!] The closer to real-time that any analytics can get, the better for everybody and the wider the lead Bidgely will have on its competitors.
Manual Training
The other aspect to Bidgely I’d like to see is more ability to manually train their model. My premise here is that the user has innate knowledge about what is going on that a system might never really understand – this should be taken advantage of.
I mentioned in an earlier post that their Appliance Analyzer app helped train the model, but I’m not so sure now. I think it was only to give you a rough idea of your usage in a manual way (which is what they said it did). But it really should be used to train my house and could be done two ways.
First, just like their little wizard does – you identify what device you are using, select Start, turn it on and it tells you when it sees the spike – done. Second, show the current usage and allow the user to select from a checklist what is currently running.
Now, using all of that data in real-time on multiple devices that turn on/off over varying durations of time – that’s still the secret sauce this team brings to the table. I look forward to seeing how they move forward as they continue to develop. It is sure interesting so far!
Offline Updates
I prefer to power down my computer equipment in the evenings, though I keep my energy monitor running. When I power it back on it the morning Bidgely won’t update with the data collected earlier. This is not a unique problem to Bidgely of course, other cloud providers have the same issue, but my Eagle does support downloading older data – so hope they could take advantage of this sync/refresh approach in the future.
The Eagle energy monitor from Rainforest Automation is a very handy device. It reads the wireless signal from my electricity meter and makes it available through a web interface – both a graphical environment and a RESTful API. In this post we look at the standard graphical screens and the data download option. Next time we’ll look at the RESTful API for programmers to use.
This is part 3 of a series of posts about the Internet of Things applied to Home Energy Monitoring.
Aside from setup screens, there are basically three screens I’ve been using today.
The first is the Current Usage tab on the Meter screen. This shows how many kiloWatts you are currently using, in a handy dial shape graphic. Along with this is an estimated cost per hour. It seems to update every 5 seconds or so. Turning on Fast Update didn’t seem to do much faster, but maybe it just wasn’t noticeable on this screen.
Eagle energy monitor Meter/Current Usage screen
At the bottom of the screen there is another chart showing where my current usage sits in the multi-tier billing system that BC Hydro uses. It’s somewhat ominous to see it slowly marching over toward the much higher tier.
Eagle Energy Monitor – Historic Usage
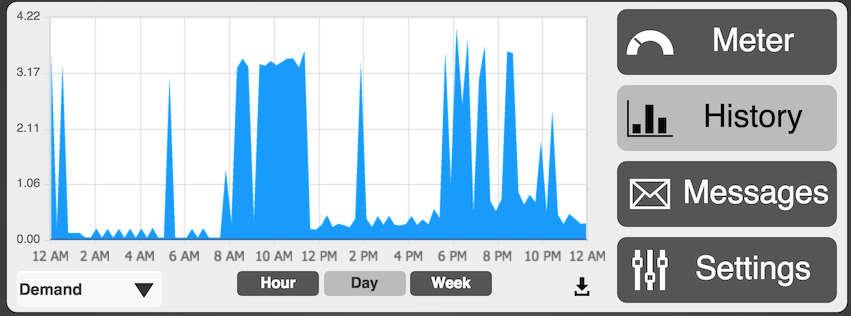
The main screen I’m usually looking at is the History screen and the Demand tab:
Eagle energy monitor demand history
The data here is straightforward. Higher line means higher power draw from the utility lines. The different time windows – hour, day, week – will summarise the data into neater representations. As a result, you might see some wild fluctuations disappear when you view a longer period of time.
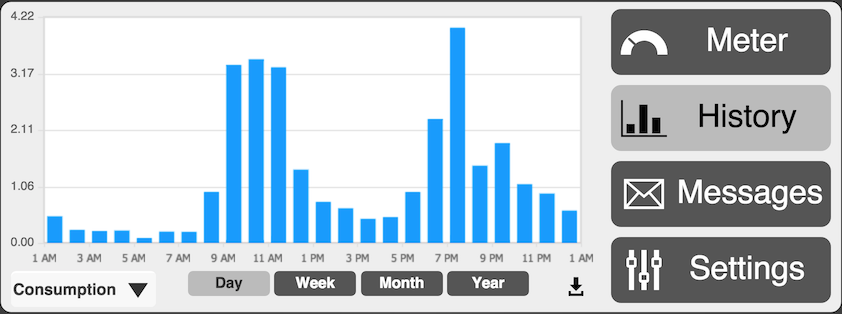
The Consumption option shows a slightly different view of the world. This chart represents more of how the electricity company will view your usage, grouped into total consumption per hour.
Eagle energy monitor historic consumption chart
In some of the cloud services you are able to switch to a cost view as well, that puts dollar values on the chart instead. More on that when we examine them in more detail.
The final item to look at here is the data download button – to the left of the Settings button. This will dump a text file that is comma delimited with two columns: timestamp in seconds and a current kiloWatt value. Open it in Excel or your favourite text editor.
As you’ll see, the timestamp frequency varies and looks to sample between 5 and 10 seconds on average. For those new to timestamps like this, it’s a very handy representation that allows time to be encoded in a single integer number. The number represents seconds since a certain date (Jan 1, 1970 midnight GMT). Convert it various ways, easiest is to use this website: epochconverter.com.
Eagle energy monitor data download as CSV file
That’s all for the basic views from the Eagle monitor web interface. Next time we’ll look at the RESTful API that lets us get at all the juicy data for our apps and further hacking.
This definitely sounds promising, anyone have experience running a similar setup?
A small company, SpinRay Energy, has announced the production of a new UL listed, grid-tied solar power system that couldn’t be easier to install. Plug-in solar power equipment may be a game changer in the arena of small residential solar power.
I see two scenarios for those in rental environments – hanging something from windows or setting up on a porch. Ultimately I guess the efficacy will be limited by size availability and cost, but size issues could be minimised if it were possible to hang PV systems in some manner without needing to screw things down into exterior walls.
Just a thought – you tried anything like this? Share any links to your favourite portable, yet substantial, systems.

 IoT Day 1: Home Energy Monitoring (3/27/2015) - In my next series of blog posts we explore an Internet of Things topic – Home energy monitoring – from a first person perspective. Join me as I install, use and hack a monitor (and related cloud services) in my new home. This is part 1 of a series of posts about the Internet of … Continue reading IoT Day 1: Home Energy Monitoring
 IoT Day 2: Cloud Services for Energy Monitoring (3/28/2015) - Energy monitoring isn’t only about knowing what’s happening right now, but also understanding what happened historically. Often that includes knowing not just what was happening but also when and why. Enter cloud services for energy monitoring. They range from simple charts and graphs to predicting your usage over time – essentially storing, analysing and enriching your … Continue reading IoT Day 2: Cloud Services for Energy Monitoring
 IoT Day 3: Viewing data on the Eagle Energy Monitor (3/29/2015) - The Eagle energy monitor from Rainforest Automation is a very handy device. It reads the wireless signal from my electricity meter and makes it available through a web interface – both a graphical environment and a RESTful API. In this post we look at the standard graphical screens and the data download option. Next time … Continue reading IoT Day 3: Viewing data on the Eagle Energy Monitor
 IoT Day 4: Bidgely Cloud Energy Monitor Dashboard (4/5/2015) - After a week of collecting smart meter readings, I’m now ready to show results in a cloud-based energy monitor system – Bidgely – complete with graphs showing readings, cost and machine learning results breaking down my usage by appliance. This is part 4 of a series of posts about the Internet of Things applied to Home Energy … Continue reading IoT Day 4: Bidgely Cloud Energy Monitor Dashboard