Would love to hear how you partition your spatial data..
As data volumes grow, so does your need to understand how to partition your data. Until you understand this distributed storage concept, you will be unable to choose the best approach for the job. This post gives an introductory explanation of partitioning and you will see why it is integral to the Hadoop Distributed File System (HDFS) increasingly used in modern big data architectures….
Running Kafka for a streaming collection service can feel somewhat opaque at times, this is why I was thrilled to find the Kafka Web Console project on Github yesterday. This Scala application can be easily downloaded and installed with a couple steps. An included web server can then be launched to serve it up quickly. Here’s how to do all that.
For a quick intro to what the web console does, see my video first. Instructions for getting started follow below, including the quick video.
The main repository for this project is available on Github (claudemamo/kafka-web-console). However, I wanted the ability to add and remove Kafka topics so I use a forked repository that has a specific branch with those capabilities. (These are planned to be added to the main project but have not been yet.)
Before doing anything further, we need another application to build and launch the console.
Download Play Framework
A program called Play with Activator is used to build and launch the web console. It’s a Java app for launching Scala apps.
Download it here, unzip it and add it to the system path so you can execute the activator command that it provides.
Build/Launch
Now back to the Kafka web console code. Enter the top level directory and execute the Play Activator start command (with one special option):
cd kafka-web-console-topic-add-remove
activator start -DapplyEvolutions.default=true

 [info] Loading project definition from /home/demo/src/tmp/kafka-web-console-topic-add-remove/project
 [info] Set current project to kafka-web-console (in build file:/home/demo/src/tmp/kafka-web-console-topic-add-remove/)

 (Starting server. Type Ctrl+D to exit logs, the server will remain in background)

 Play server process ID is 8528
 [info] play - database [default] connected at jdbc:h2:file:play
 [info] play - Starting application default Akka system.
 [info] play - Application started (Prod)
 [info] play - Listening for HTTP on /0:0:0:0:0:0:0:0:9000
The first time it runs will take some time to build the source and then launch the web server.
In the last line, above, you see it launches by default on port 9000.
Configuring the Console
Step 1 – Register your Zookeeper instance
Now you can launch the web console and start using the application. Step 1 figure shows the basic form for your Zookeeper configuration details. This is the only setup step required to get access to your Kafka brokers and topics.
Step 3 – Topics tab lists the Kafka topics. Note that this forked version provides the red “delete” button for each topic, as well as the additional “create topic” tab above.
Step 4 – Selecting a topic allows you to see an active topic stream.
Between classic business transactions and social interactions and machine-generated observations, the digital data tap has been turned on and it will never be turned off. The flow of data is everlasting. Which is why you see a lot of things in the loop around real time frameworks and streaming frameworks. – Mike Hoskins, CTO Actian
From Mike Hoskins to Mike Richards (yes we can do that kind of leap in logic, it’s the weekend)…
Oh, Joel Miller, you just found the marble in the oatmeal! You’re a lucky, lucky, lucky little boy – because you know why? You get to drink from… the firehose! Okay, ready? Open wide! – Stanley Spadowski, UHF
Firehose of Terror
I think you get the picture – a potentially frightening picture for those unprepared to handle the torrent of data that is coming down the pipe. Unfortunately, for those who are unprepared, the disaster will not merely overwhelm them. Quite the contrary – I believe they will be consumed by irrelevancy.
I agree that the tap has been turned on, maybe not at the full blast of power or under maximum control, yet the data is coming and already well beyond a trickle. The helter-skelter implementations of big data solutions out there has, perhaps, created more of a turbulent blasting firehose than a meandering stream of flowing data. And this is only the beginning.
Success is Still Newsworthy
We are still at the stage where designing a (successful) enterprise system built around streaming data, for example, is big news. Why is it news? Because building is harder than merely planning, especially when new open source projects continue to push us beyond the bleeding edge. New tools are helping us see how we can handle more data and find more value, but they are also making the pool of data so much larger that the tools themselves are often irrelevant by the time they are adopted.
For example, MapReduce was awesome, until it began to be so widely adopted that its limitations became apparent. It’s like finding the marble in a sandbox filled with oatmeal – not easy, but when you find it, you’re a winner! Oh, the prize is a fierce typhoon of even more data coming your way. Congratulations! (Sorry you didn’t prepare for that.)
So where does this leave organisations that have no ability to handle more than a trickle of data?
It’s a win or lose scenario – either you can do something about it or you can’t. As software developers or data managers we won’t be judged along some smooth gradation of skills and capabilities.
We’ll be judged against a checklist Yes or no.
Pass or fail.
Win or lose.
Firehose or … an icky pail to hide in the closet.
Data’s Need for Speed
Why is it a pass/fail scenario? Consider your car – is it successful when it mostly starts in the morning? Never. Anything beyond fully starting is a complete failure because that is what it is designed to do.
I argue that today’s data streams are being designed to handle data at maximum velocity. Sure many services aren’t producing millions of records per second, but as we gear up with the latest toolsets, we make the tools themselves hunger and thirst to get more and more data into their greedy little hands. Feed the beast – or ignore it at your peril.
Systems today are designed to run at full throttle – 100% – all out – maximum overdrive. None of us would like to have pay for premium broadband and find that we only use 10% of our bandwidth. Likewise, our systems are waiting for us to crank up the volume to see what we’ll do next.
Our data economy inherently wants to run at maximum but much of the old plumbing needs upgrades to function at that rate. You’d be irate if the fire department ran their hoses at 10% power when trying to douse your burning home. However, if they told you later that max pressure would burst the old hoses and you’d have no water, then you might be a little more appreciative.
Patch up those hoses so they are tested and ready. Buckle up the survival suit. Start digging through the oatmeal and open wide. Be forewarned – if you are not searching for the marble, you can never find it. If cannot find it, you’ll be sent home empty handed.
—-
p.s. If you don’t win, I highly doubt you’ll even receive a lousy copy of the home edition.
[UPDATE: Check out the Kafka Web Console that allows you to manage topics and see traffic going through your topics – all in a browser!]
When you’re pushing data into a Kafka topic, it’s always helpful to monitor the traffic using a simple Kafka consumer script. Here’s a simple script I’ve been using that subscribes to a given topic and outputs the results. It depends on the kafka-python module and takes a single argument for the topic name. Modify the script to point to the right server IP.
from kafka import KafkaClient, SimpleConsumer
from sys import argv
kafka = KafkaClient("10.0.1.100:6667")
consumer = SimpleConsumer(kafka, "my-group", argv[1])
consumer.max_buffer_size=0
consumer.seek(0,2)
for message in consumer:
 print("OFFSET: "+str(message[0])+"\t MSG: "+str(message[1][3]))
Max Buffer Size
There are two lines I wanted to focus on in particular. The first is the “max_buffer_size” setting:
consumer.max_buffer_size=0
When subscribing to a topic with a high level of messages that have not been received before, the consumer/client can max out and fail. Setting an infinite buffer size (zero) allows it to take everything that is available.
If you kill and restart the script it will continue where it last left off, at the last offset that was received. This is pretty cool but in some environments it has some trouble, so I changed the default by adding another line.
Offset Out of Range Error
As I regularly kill the servers running Kafka and the producers feeding it (yes, just for fun), things sometimes go a bit crazy, not entirely sure why but I got the error:
If you set it to (0,0) it will restart scanning from the first message. Setting it to (0,2) allows it to start from the most recent offset – so letting you tap back into the stream at the latest moment.
Removing this line forces it back to the context mentioned earlier, where it will pick up from the last message it previously received. But if/when that gets broke, then you’ll want to have a line like this to save the day.
SPARQLverse is the graph analytics engine produced by SPARQLcity. Standards compliant and super fast!
I’ve been spending a lot of time this past year running queries against the open source SPARQLversegraph analytic engine. It’s amazing how simple some queries can look and yet how much work is being done behind the scenes.
My current project requires building up a set of query examples that allow typical kinds of graph/network analytics – starting with the kinds of queries needed for Social Network Analysis (SNA), i.e. find friends of friends, graph density and more.
In this post I go through computing graph density in detail.
First of all I’d love to hear what your favourite SPARQL query patterns are in this space. Please ping/tweet me if you have some that you find yourself using over and over!
My starting point is with some of the samples SPARQLcity makes available on their tips and tricks page. Let’s first look at a sample dataset and then apply a couple of these to a query problem.
Installing SPARQLverse Graph Analytic Engine
Installing SPARQLverse on a Linux machine is dead simple (you’ll need 8GB RAM by default):
Now if you have an RDF/Turtle format triples file you can load it via command line – provide the name of graph to create, and your input filename:
ploadsbx mygraph graph_friends.ttl
Sample Turtle Format Data for SPARQL
Don’t be scared away from RDF/Turtle or triple stores in general due to the new format. Triples don’t get much simpler than just three URIs or even just three distinct words on a line.
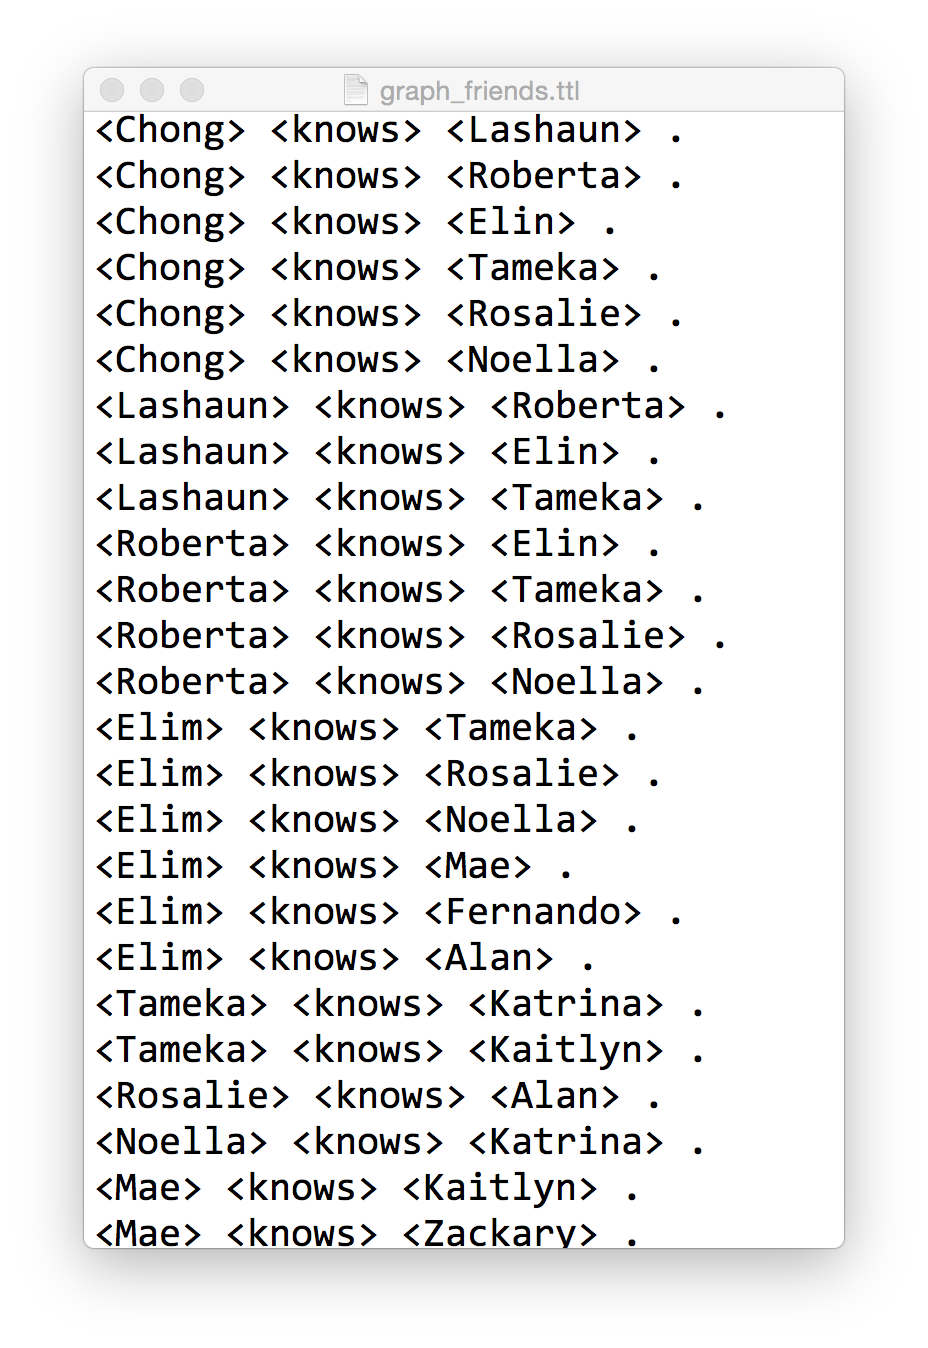
Here is what a sample looks like (graph_friends.ttl) that we can load into SPARQLverse with the above command:
Sample friends graph in Turtle format for loading into SPARQLverse graph analytic engine.
It includes 57 specific relationships. The first part of the triple is the Subject, the second is the Predicate/relationship made to the third part, the Object. If you look through the data you’ll see that all the Objects are also defined as Subjects that have other relationships.
Understand the basics here and you’ve got Triples almost mastered.
Note: This is an overly simplistic example, but not totally unrealistic. We don’t use any URIs but we are allowed to fake them here by simply putting angle brackets around them. In a linked data environment you’d establish your own namespaces and likely link to external SPARQL endpoints or resources with http:// prefixes. Now that starts to make your eyes crossed.
Quick Visualisation
As an aside, pull the sample data into Gephi to visualise it and you’ll see the intertwining relationships are not intuitive and would be a challenge to understand using a SQL relational approach.
Graph density represents how interconnected all entities in the graph are. They are a sort of ratio between the total number of connected nodes over maximum number of potential edges. The value ranges from 0 to 1 – with 0 being a total disconnected graph (not sure if that is technically a graph) with no interconnections between nodes. And 1 representing a high density graph where all nodes connect to all other nodes.
Here we use a SPARQL query to compute graph density, using the sample dataset above, run from the command line. (Note that I use “?knows” as a predicate when I really want to use “<knows>” but wordpress is not displaying that properly):
$ isbx -c "
 SELECT (?nrEdges/(?nrNodes *(?nrNodes - 1.0)) AS ?graphDensity)
 FROM <graphname>
 WHERE {
  { SELECT (COUNT (*) AS ?nrEdges) (COUNT (DISTINCT ?person) AS ?nrNodes)
    WHERE { ?person ?knows ?anotherPerson . }
   }
 }
"
graphDensity
-------------
0.150000
I changed the example “tips” query to use a different graph name (mygraph) and a different relationship name (knows). The sub-query in the WHERE clause first counts up the number of edges/relationships and counts the distinct number of nodes as well. Then the primary query compares that number of edges to nodes.
Let’s break that down into its detail…
Compute the number of unique nodes in the graph
$ isbx -c "SELECT (count (distinct ?person) as ?nrNodes)
> FROM <graphname> WHERE { ?person ?knows ?anotherPerson .}"
nrNodes
--------
20
This tells us that there are 20 people as Subjects in the graph. Therefore, a maximum number of edges between all people would be 20² (we’ll use only 20×19 as a person might not link to themselves in this example).
Compute the number of edges in the graph
$ isbx -c "SELECT (count (*) as ?nrEdges)
FROM <graphname> WHERE { ?person ?knows ?anotherPerson .}"
nrEdges
--------
57
Total edges is 57. Do the quick math and see that the ratio is then:
57 / (20 x 19)
= 57 / 380
= 0.149...
Challenge: Inverse Relationships in SPARQL
In some graphs you may not have all the people in the Object position (third part of triple) initialised as Subjects – and their names only show up when someone else defines a relationship to them.
In that case, your density from this query will under-report. I leave it as an exercise to the reader to figure out how to use SPARQL to do an optional inverse relationship in the sub-query WHERE clause. Ping me if you want some tips on that.
Future Post
In a future post I’ll walk through some of other graph query examples using SPARQL such as:
SPARQLverse is part of the Actian Analytics Platform – providing Big Data solutions that are hyper performance with ultimate scalability. Our SQL in Hadoop is the fastest available and runs truly in Hadoop 100%.
To publish to Kafka I built a C# app that uses the Kafka4n libraries – it doesn’t get much simpler than this:
using Kafka.Client;

Connector connector = new Connector(serverAddress, serverPort);
connector.Produce(correlationId, hostName, timeOut, topicName, partitionId, message);
I was reading from various event and performance monitoring logs and pushing them through just fine.
Basic Python Kafka Consumer
For watching the realtime feed, I created a consumer on a Linux machine using the Python kafka-python package:
from kafka import KafkaClient, SimpleConsumer
kafka = KafkaClient("10.0.1.223:6667")

consumer = SimpleConsumer(kafka, "my-group", "winlogs")
for message in consumer:
  print(message)
This worked great until I started pushing in a lot of data both in size and quantity. Eventually I started getting an error that seems to relate to the max size my consumer could request:
No handlers could be found for logger "kafka"
Traceback (most recent call last):
 File "consume_winlogs.py", line 5, in <module>
 for message in consumer:
 File "/usr/lib/python2.6/site-packages/kafka/consumer.py", line 406, in __iter__
 message = self.get_message(True, timeout)
 File "/usr/lib/python2.6/site-packages/kafka/consumer.py", line 365, in get_message
 return self._get_message(block, timeout, get_partition_info)
 File "/usr/lib/python2.6/site-packages/kafka/consumer.py", line 378, in _get_message
 self._fetch()
 File "/usr/lib/python2.6/site-packages/kafka/consumer.py", line 438, in _fetch
 for message in resp.messages:
 File "/usr/lib/python2.6/site-packages/kafka/protocol.py", line 134, in _decode_message_set_iter
 raise ConsumerFetchSizeTooSmall()
kafka.common.ConsumerFetchSizeTooSmall
So I tweaked my publisher to make sure it wasn’t putting in really large messages (which wasn’t needed for my application anyway) and then cleared the Kafka topic.
Clearing Kafka Topics with Python
After trying a few different approaches to clearing the topic, I found this python approach to be simplest, using the zc.zk module. First I listed the contents from Zookeeper:
Which showed the topics and consumers that were of interest to me . I found deleting topics was not enough, I had to also reset the consumer data here so my script would not try to pick up where it left off:
(Okay, so you can be up and running quicker if you have a better internet connection than me.)
Want to get your hands dirty with Hadoop related technologies but don’t have time to waste? I’ve spent way too much time trying to get HBase, for example, running on my Macbook with Brew and wish I had just tried this Virtualbox approach before.
In this short post I show how easy it was for me to get an NFS share mounted on OSX – so I could transparently and simply copy files on HDFS without needing any special tools. Here are the details…
Hortonworks Sandbox is an excellent virtual machine file, that’s primed and loaded with all the tools you would want to try out. Best of all, it’s free and a simple (meh) 2.5GB download. Virtualbox, VMWare and Hyper-V versions are all available.
Once I launched it, I had access to a simple web console, showing me all the varied apps I have running.
HDP main web console
Here I enabled Ambari and was able to access that dashboard right away. (Some tutorials say you have to reboot the VM, but I didn’t have to.)
HDP Ambari dashboard
The first thing I wanted to do was enable file access via NFS. You read that right – I had heard earlier today that Hortonworks Data Platform (HDP) supported NFS right out of the box. To be fair, I don’t know what others are doing, so maybe this is old news, but it was good news for me.
So using various configuration windows via Ambari, I went through a tutorial for configuring NFS capabilities. However, to my joy, I found that all the configuration changes I needed to make were already made by default! So, NFS by default sounded good to me.
After switching Virtualbox from NAT networking to Bridged mode, I then told OSX to mount the drive. Et voila!
Mounting NFS share from HDP HDFS on OSX
So I’m just getting started with using this Sandbox environment but it was definitely a timesaver for setting up a development environment.
I’ll want to jump into testing HBase with some other work I’m doing, but I may also get tempted into trying various other apps they’ve packaged neatly into this distribution.. when I have some spare time that is. 😉