Trick serving a hillshade image from GeoServer

I had the perfect hillshade raster ready to throw on top of my web map, I had previewed it in QGIS and the colour stretching and values looked fine.
Hillshade in QGIS

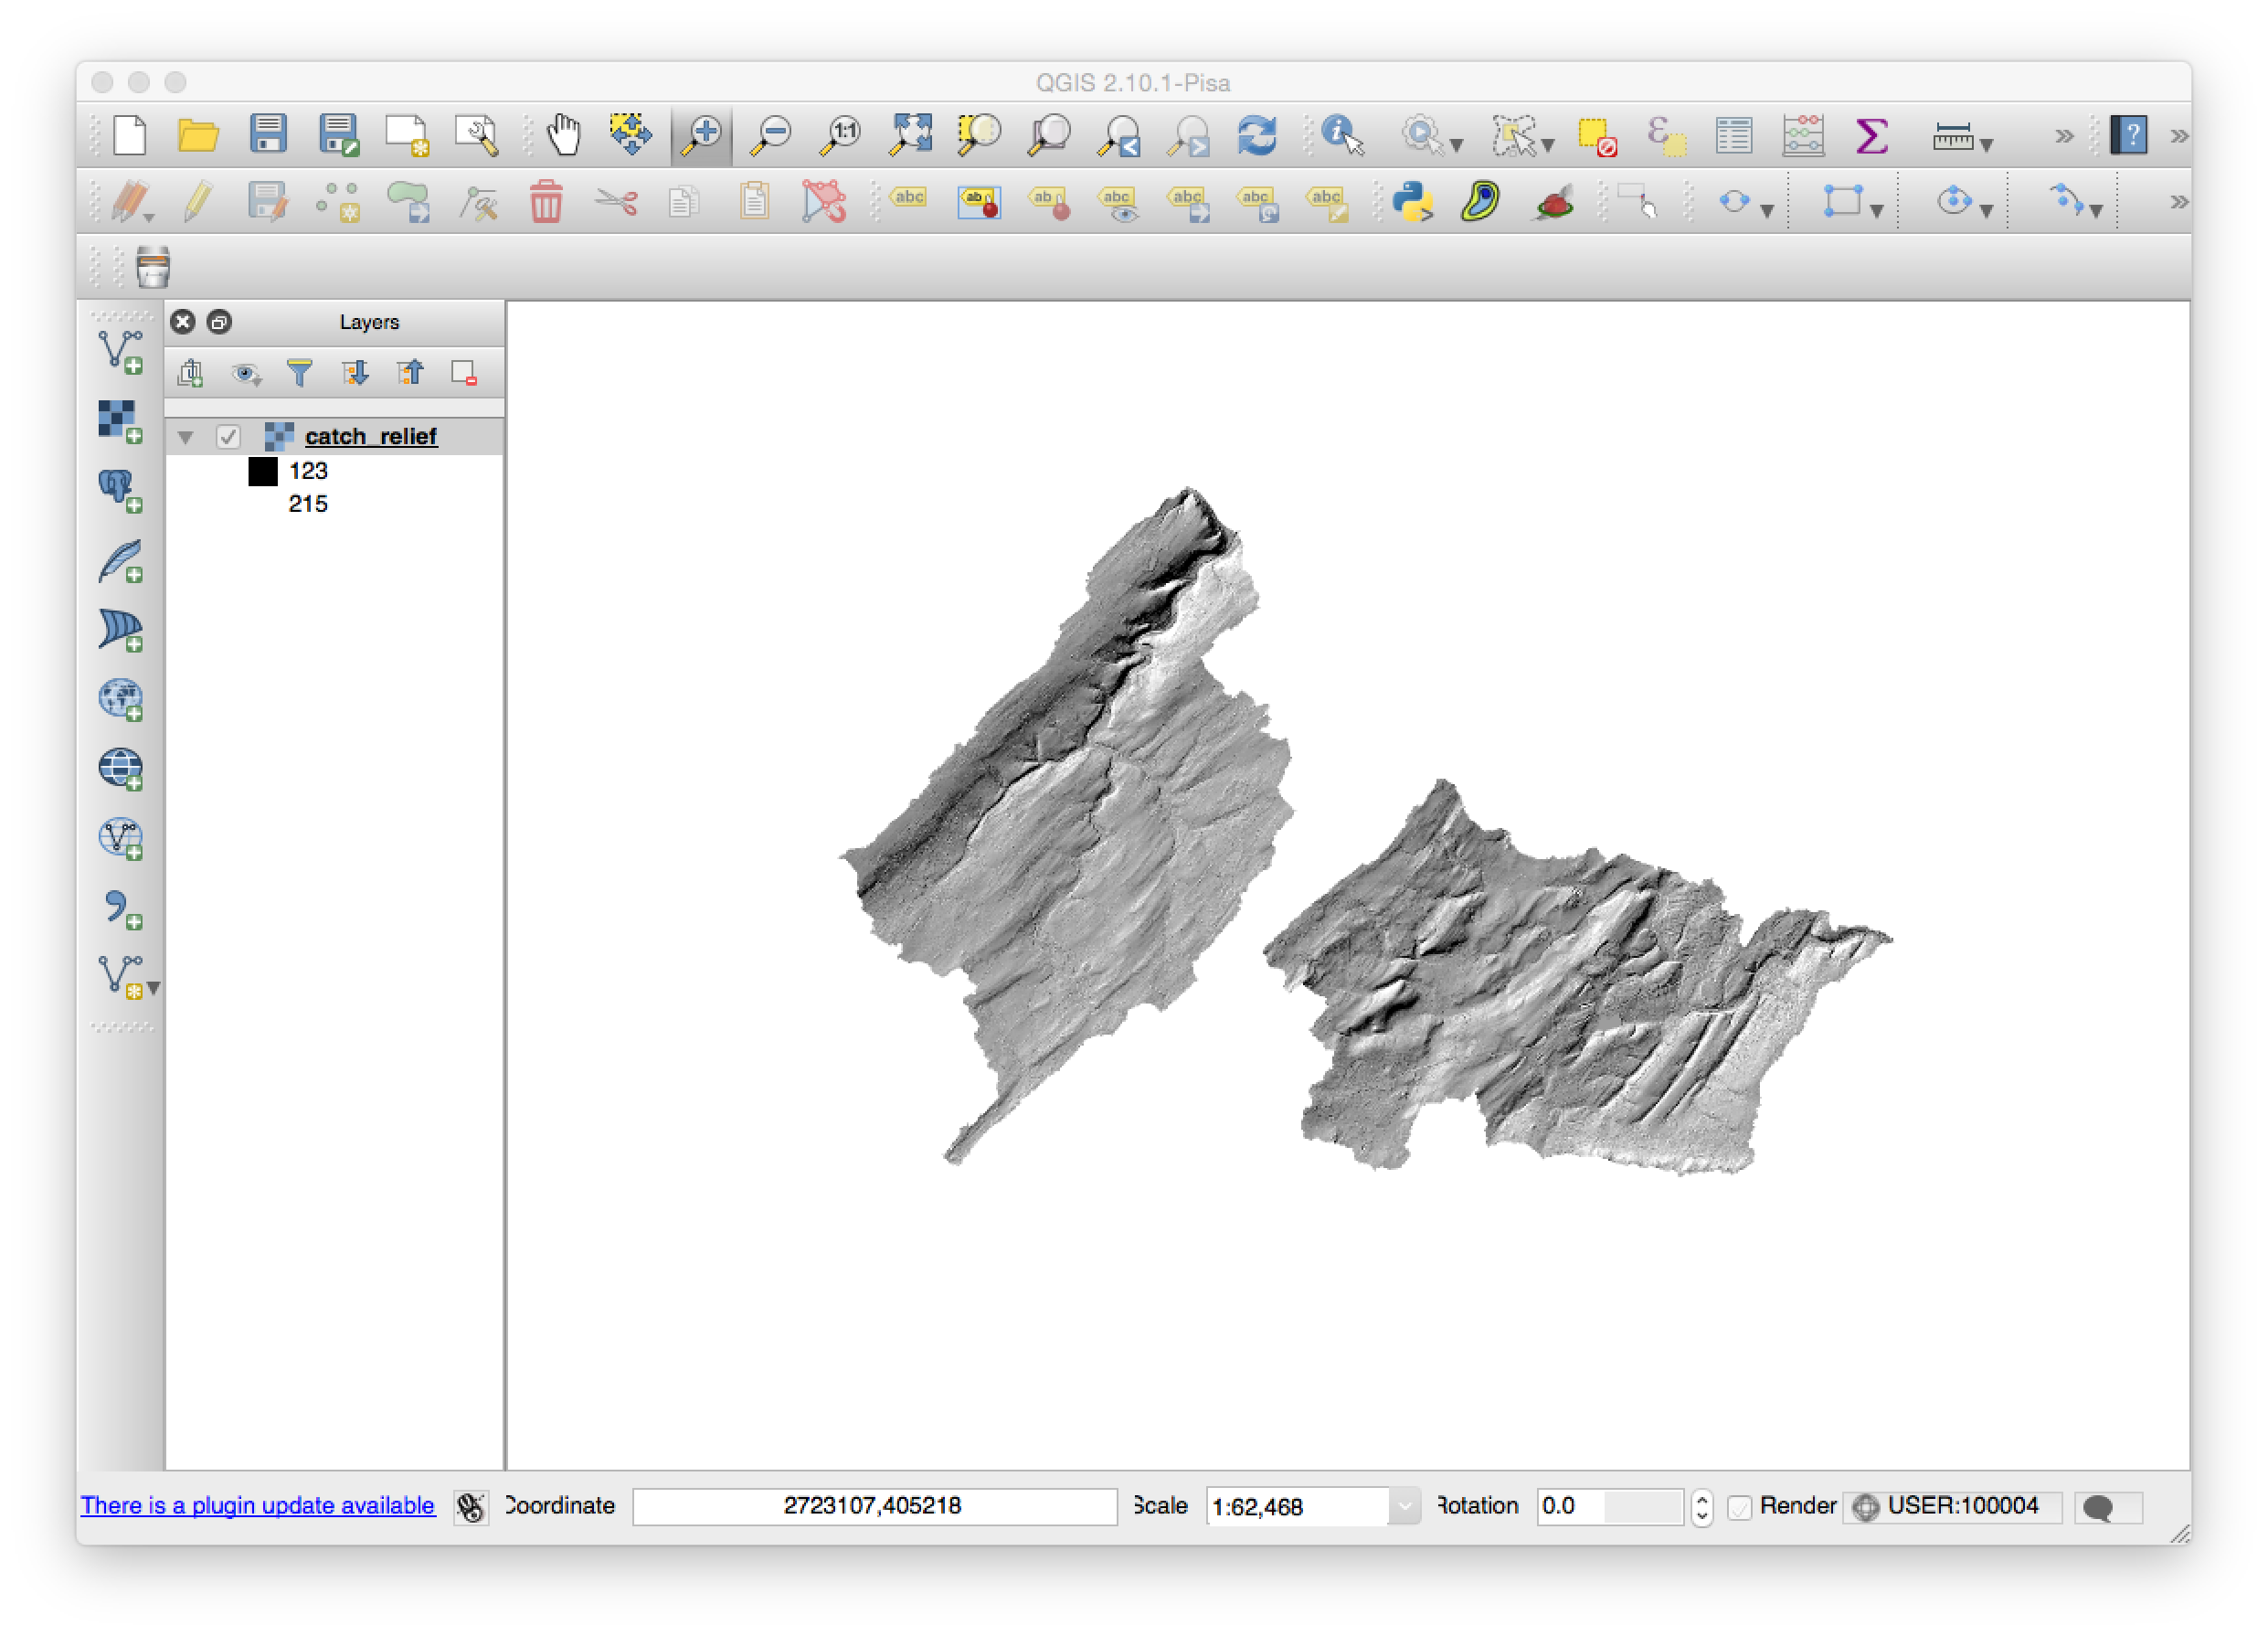
I then loaded it into GeoServer and it looked great in the OpenLayers Layer Preview window as well.

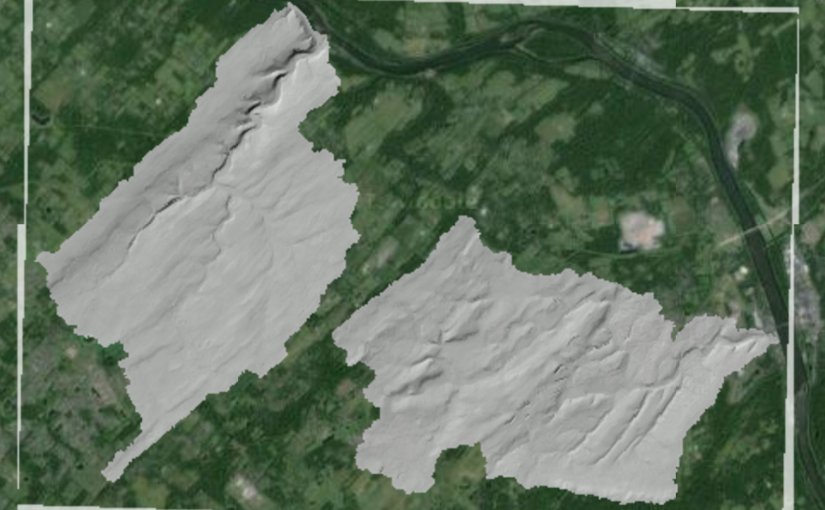
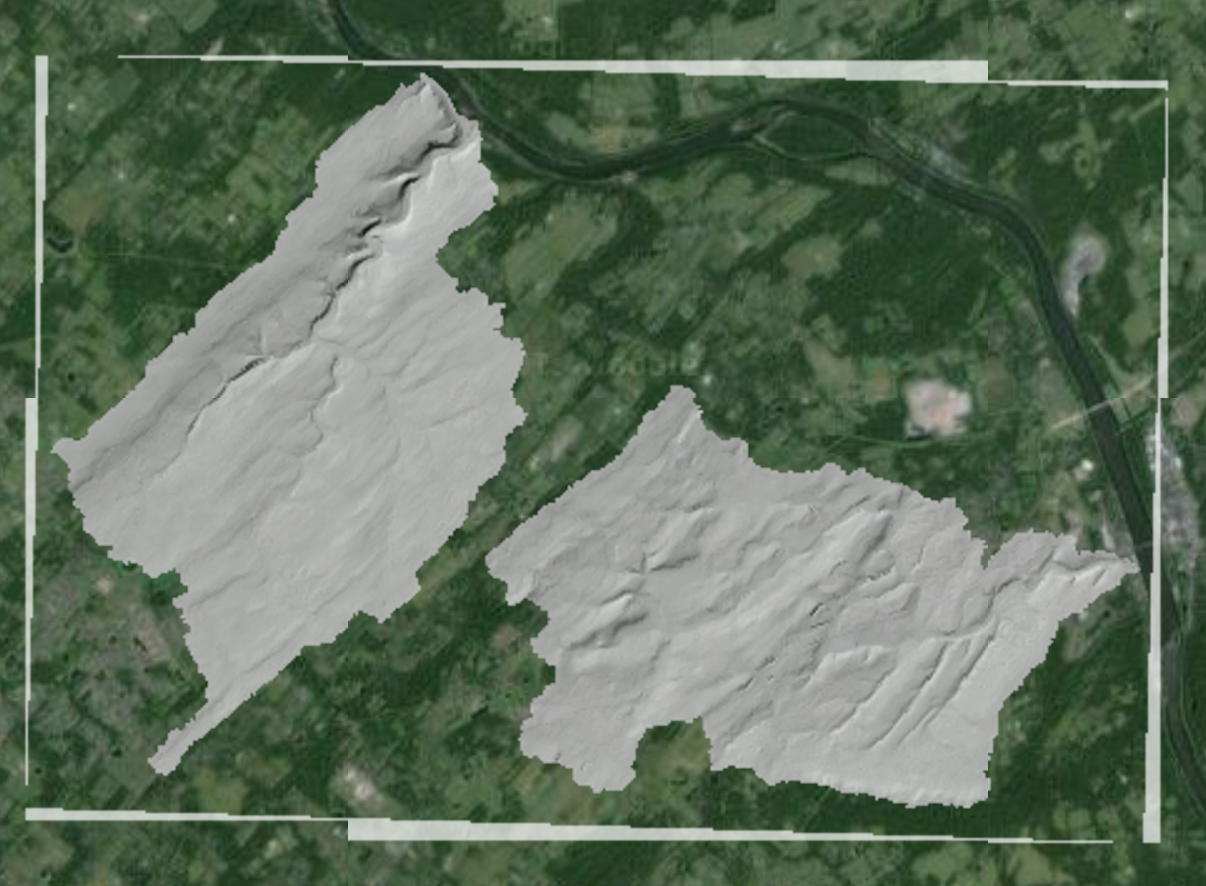
However, once I added it as a WMS layer in a Leaflet map, I got really confused.  Even though I had my NODATA=255 parameters seemingly working well there appeared a small strip around the outside of the image that was obnoxious.

When GeoServer skews the image it creates a region around the image that has value=0.  This image already had nodata=255, so it can be very confusing.
When GeoServer skews the image it creates a region around the image that has value=0. This image already had nodata=255, so it can be very confusing.

I figured I could change it with an SLD but hadn’t done it before so it took a while to figure out.  For a couple hours I tried various permutations of the default “raster” Style, but with no luck.  The image, otherwise, looked great so the Style obviously wasn’t a real problem in and of itself.

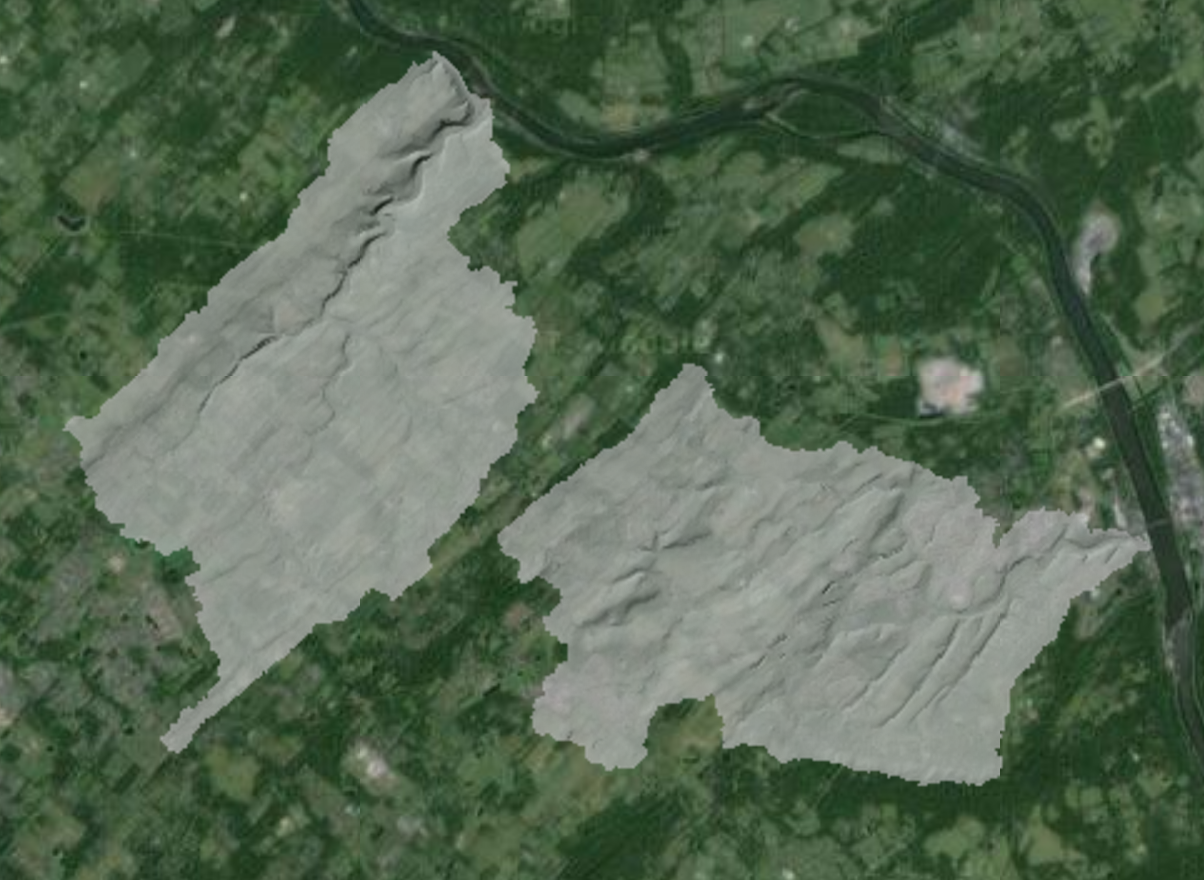
The trick came when I realised that I need to set my color maps for the gray band explicitly.  Up to this point no particular band had been isolated for color mapping.  I found the right place to put the elements in the SLD and all worked out well.

My takeaway: there must be a better way to develop SLD for rasters.  The options in the GeoServer docs are amazing and exciting, but trying to fit them into a specific context has always been a challenge for me.  That’s why I had to write this down, but I’m sure I’ll have to remember it all again a year from now!

Note there is no skewed "collar" around the image as value=0 is ignored.
Note there is no skewed “collar” around the image as value=0 is ignored.

 
My SLD:


    default_hillshade
    
      Raster Hillshade
      Grayscale hillshade SLD
      
        
          rule1
          Hillshade with transparency
          Ignore values outside valid range, nodata values transparent


                	1


High speed water flow simulation on a DEM

I’m helping some friends who are working on a project to visualise a whole whack of GIS data in Unity (Unity3D.com) game engine.  It looks like we’ll end up working on a GIS -> Unity workflow for generating terrains from DEMs and texture maps from orthophotos.  To top it off they’ve already got a landcover classification app running that takes landcover raster classes and creates 3D objects (grass, trees, water) in the model.  (Don’t worry, I won’t tease you by mentioning their voxel based subsurface soil model interaction).  It’s still early but really encouraging so far.

Next up is to simulate water flow in the environment and it was slim pickings for options for doing this.  Then they found the Unity asset called Surface Waves (US$80) – it does the water flow work we wanted but much more.  I just posted a really short test video to see how it worked – with both an auto generated water source and a manual placement water source, like a paint brush, that allows you to see how things will flow. It is amazingly performant on a notebook.

Be sure to check out Surface Waves’ demo video – it frees you from trying to emulate the look of water movement through shader trickery to actually simulating water flow over and around objects.  Things that used to take a sophisticated GIS quite a while to compute actually, the last time I tried anyway 🙂

More to come as we play around with it, but I put it out there in case other spatially oriented folks might be interested as well in the GIS -> Unity workflow challenges being worked through.  If so, I’ll do more video highlighting the work that’s underway.

Web Mapping Illustrated – 10 year celebration giveaway [ENDED!]

web-mapping-tyler-mitchell-large
My O’Reilly, 2005 book

Update: All copies are gone!  If you want Geospatial Desktop or Geospatial Power Tools – go to LocatePress.com – quantity discounts available.  For Web Mapping Illustrated go to Amazon.


I’m giving away a couple copies of my circa 2005 classic book.  Details below…  When O’Reilly published Web Mapping Illustrated – Using Open Source GIS Toolkits – nothing like it existed on the market.  It was a gamble but worked out well in the end.

Primarily focused on MapServer, GDAL/OGR and PostGIS, it is a how-to guide for those building web apps that included maps.  That’s right, you couldn’t just use somebody else’s maps all the time – us geographers needed jobs, after all.

To help give you the context of the times, a couple months before the final print date, Google Maps, was released.  I blithely added a reference to their site just in case it became popular.

The book is still selling today and though I haven’t reviewed it in a while, I do believe many of the concepts are still as valid as when it was written.  In fact, it’s even easier to install and configure the apps now due to packaging and distribution options that didn’t exist back then.  Note this was also a year before OSGeo.org’s collaborative efforts started to help popularise the tools further.

In celebration of 10 years of sales I have a couple autographed copies as giveaways to the first two people who don’t mind paying only for the shipping (about USD$8) and who drop me a note expressing their interest.

Additionally, I have some of Gary Sherman’s excellent Geospatial Desktop books as giveaways as well.  Same deal, pay actual shipping cost only from my remote hut in northern Canada.  Just let me know you’d like one of them and I’ll email you the PayPal details.  Sorry, not autographed by Gary, though I was editor and publisher, so could scribble on it for you if desired.

%d bloggers like this: